SAR and Infrared Image Fusion in Complex Contourlet Domain Based on Joint Sparse Representation
DOI: 10.12000/JR17019 cstr: 32380.14.JR17019
-
Abstract: To investigate the problems of the large grayscale difference between infrared and Synthetic Aperture Radar (SAR) images and their fusion image not being fit for human visual perception, we propose a fusion method for SAR and infrared images in the complex contourlet domain based on joint sparse representation. First, we perform complex contourlet decomposition of the infrared and SAR images. Then, we employ the K-Singular Value Decomposition (K-SVD) method to obtain an over-complete dictionary of the low-frequency components of the two source images. Using a joint sparse representation model, we then generate a joint dictionary. We obtain the sparse representation coefficients of the low-frequency components of the source images in the joint dictionary by the Orthogonal Matching Pursuit (OMP) method and select them using the selection maximization strategy. We then reconstruct these components to obtain the fused low-frequency components and fuse the high-frequency components using two criteria——the coefficient of visual sensitivity and the degree of energy matching. Finally, we obtain the fusion image by the inverse complex contourlet transform. Compared with the three classical fusion methods and recently presented fusion methods, e.g., that based on the Non-Subsampled Contourlet Transform (NSCT) and another based on sparse representation, the method we propose in this paper can effectively highlight the salient features of the two source images and inherit their information to the greatest extent.
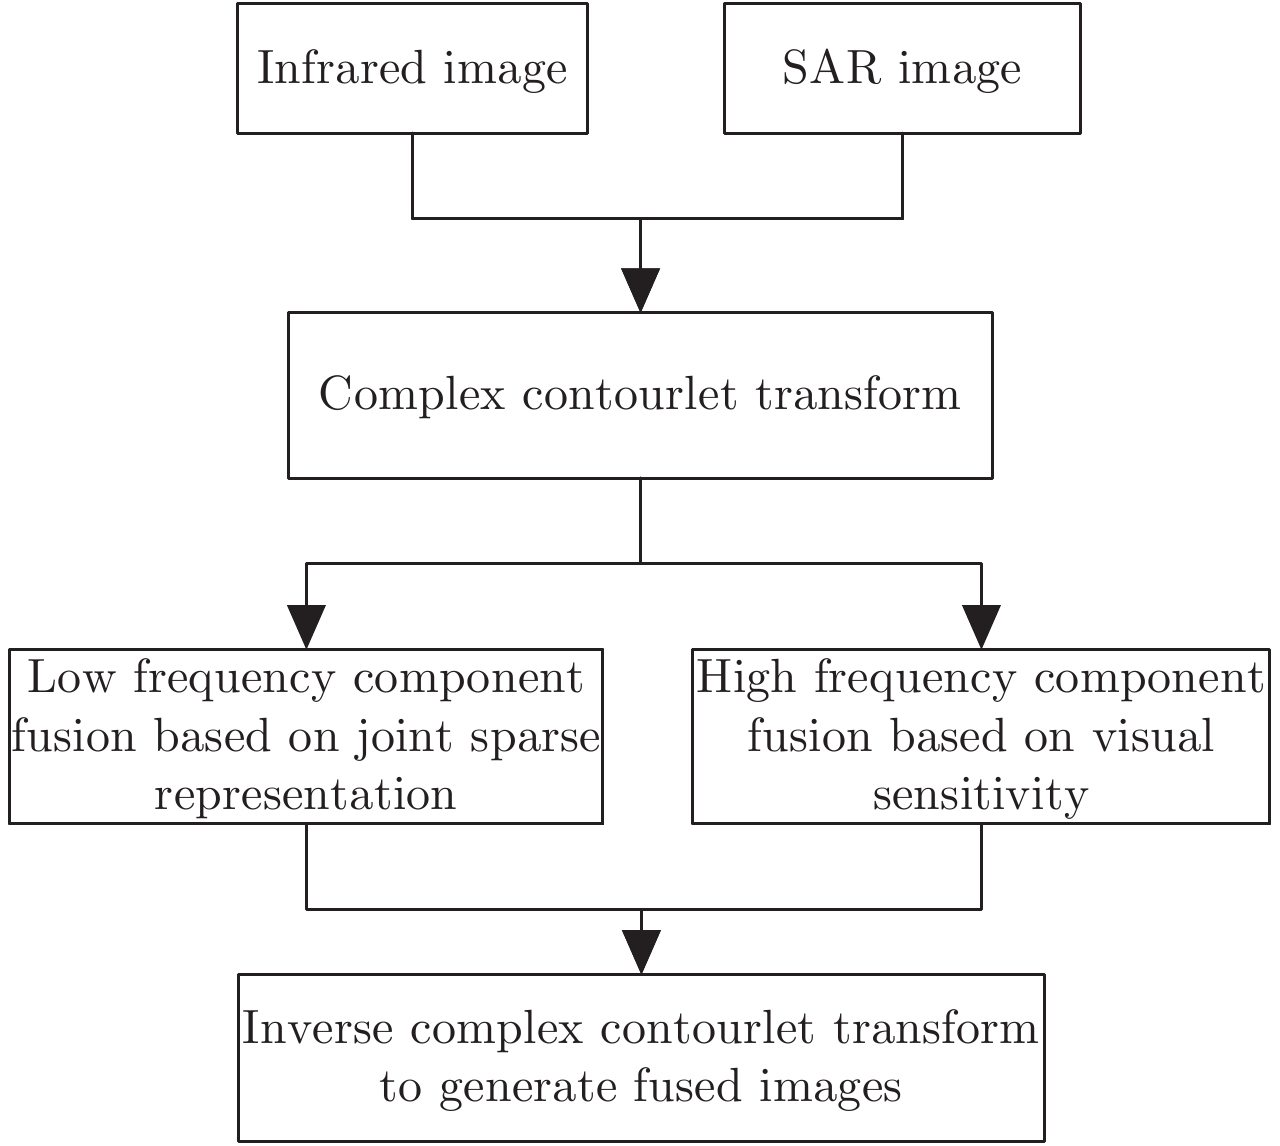
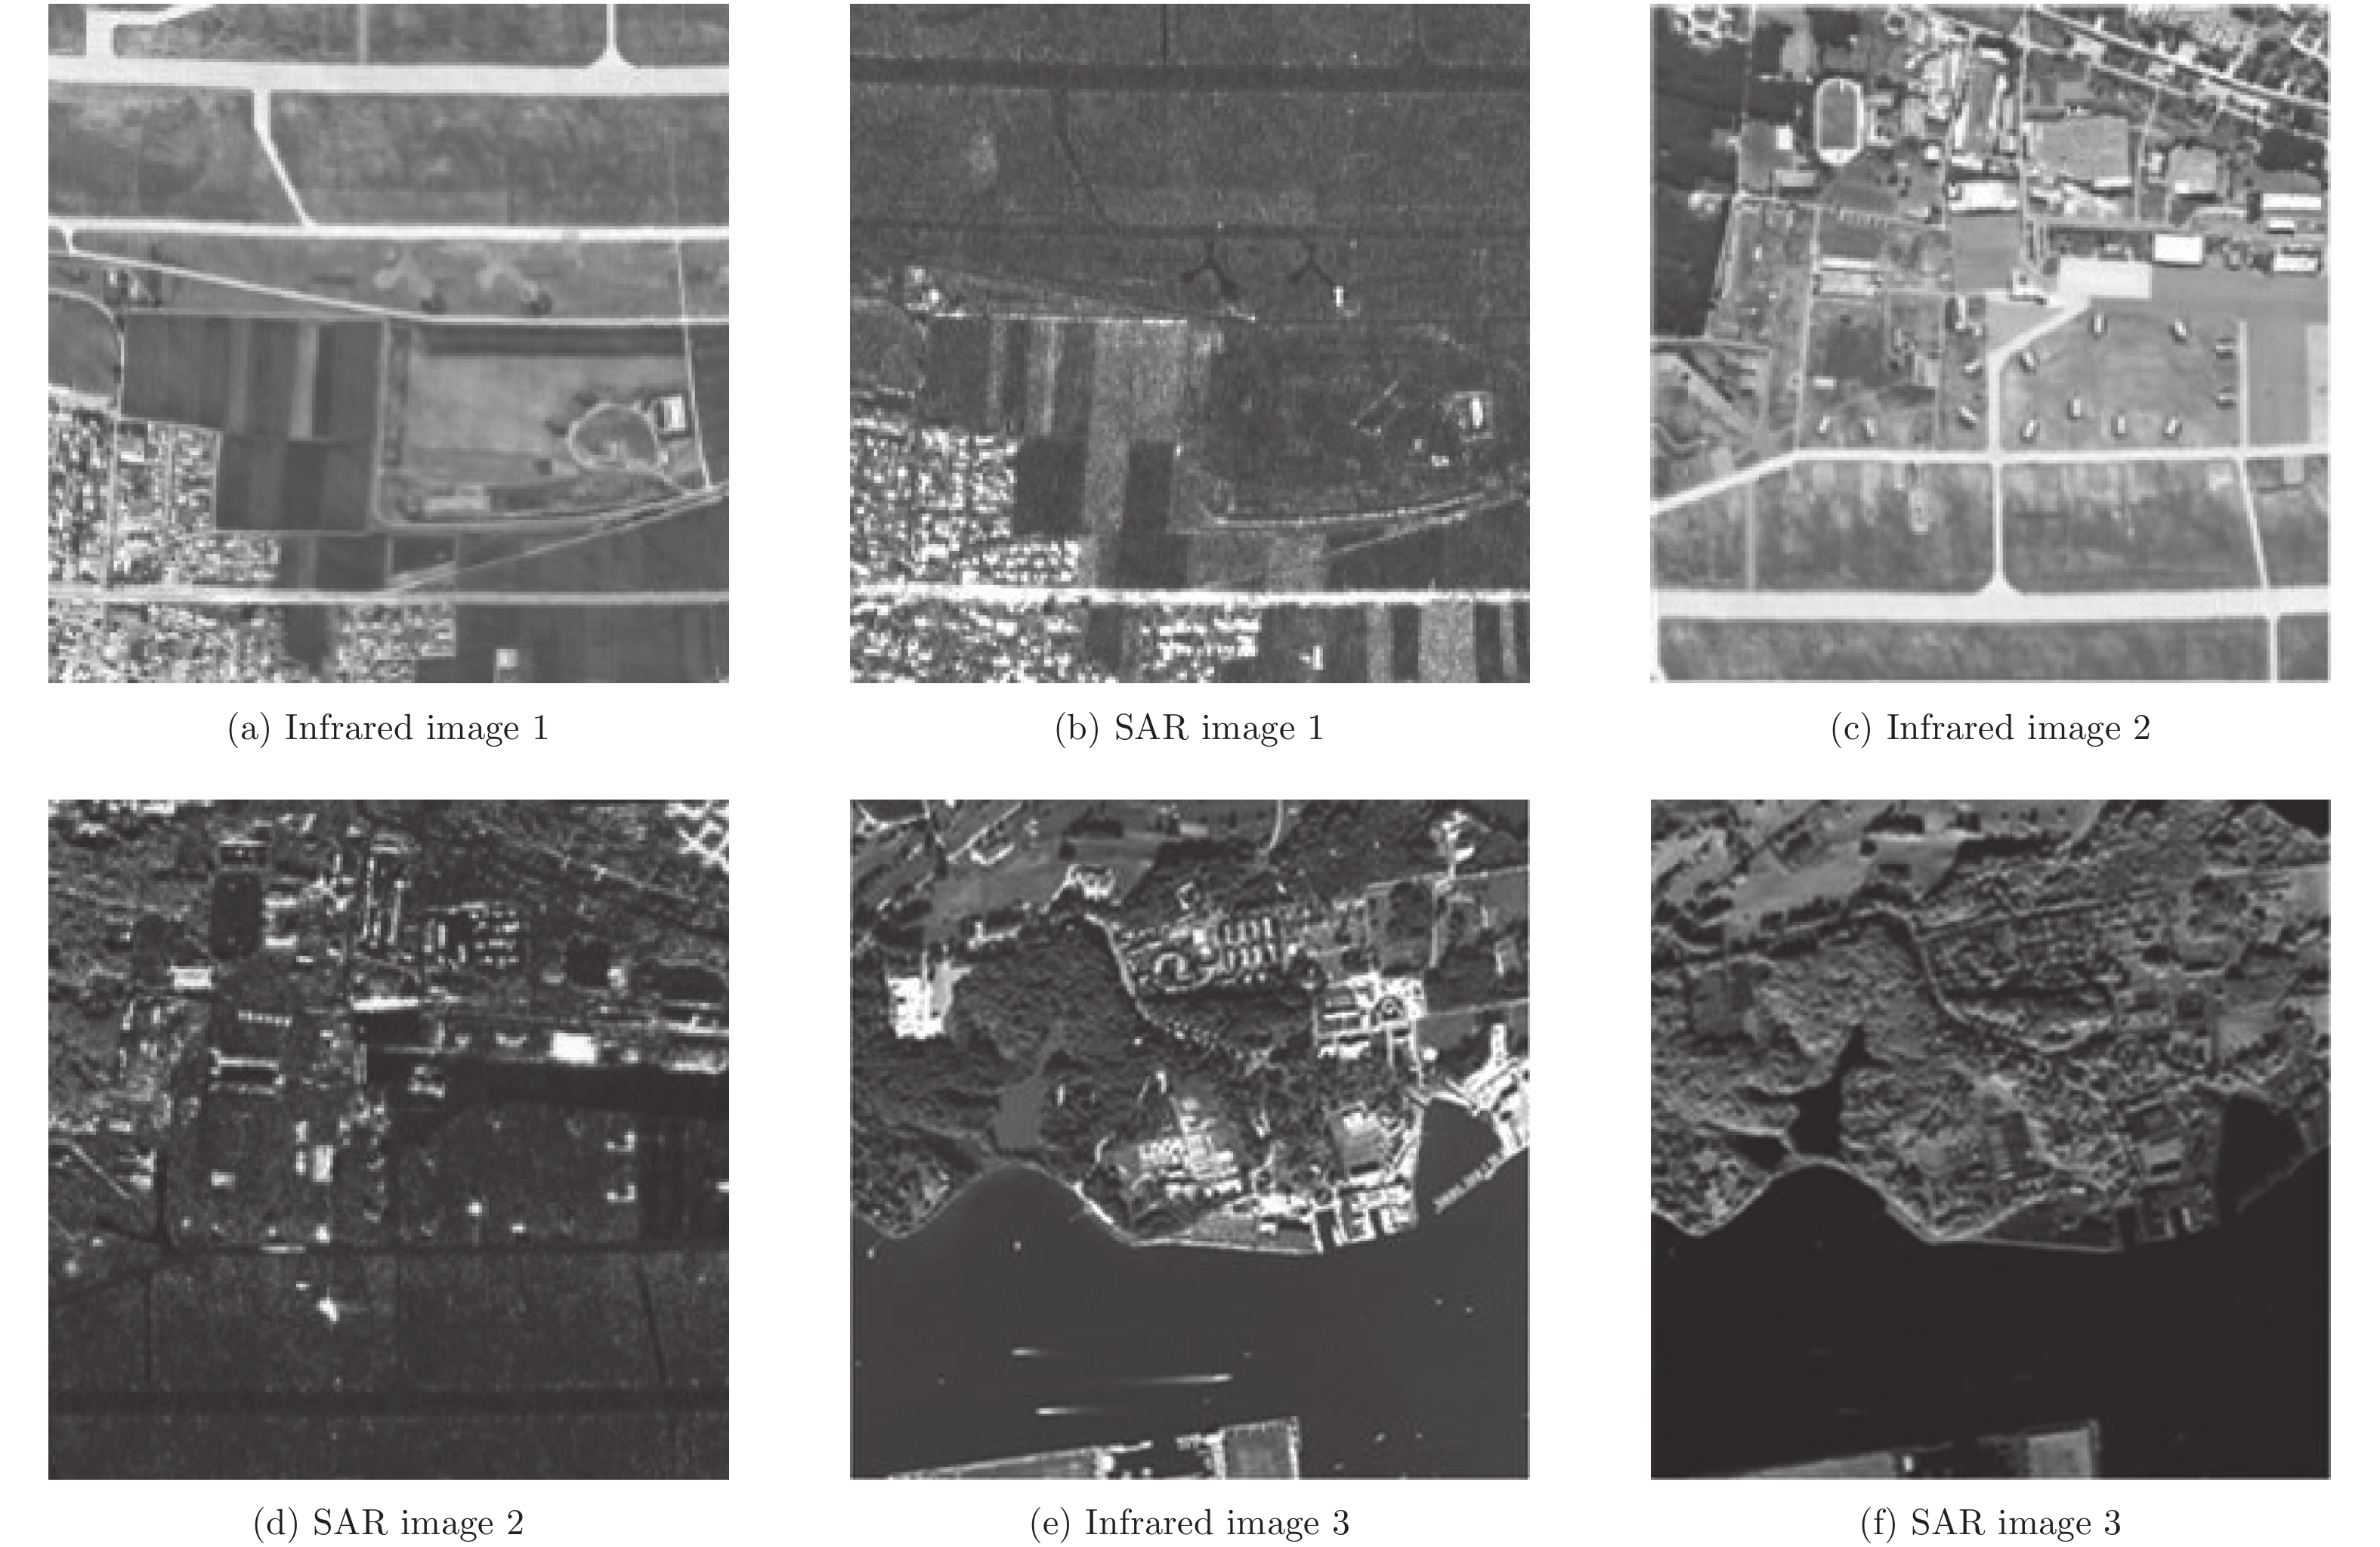
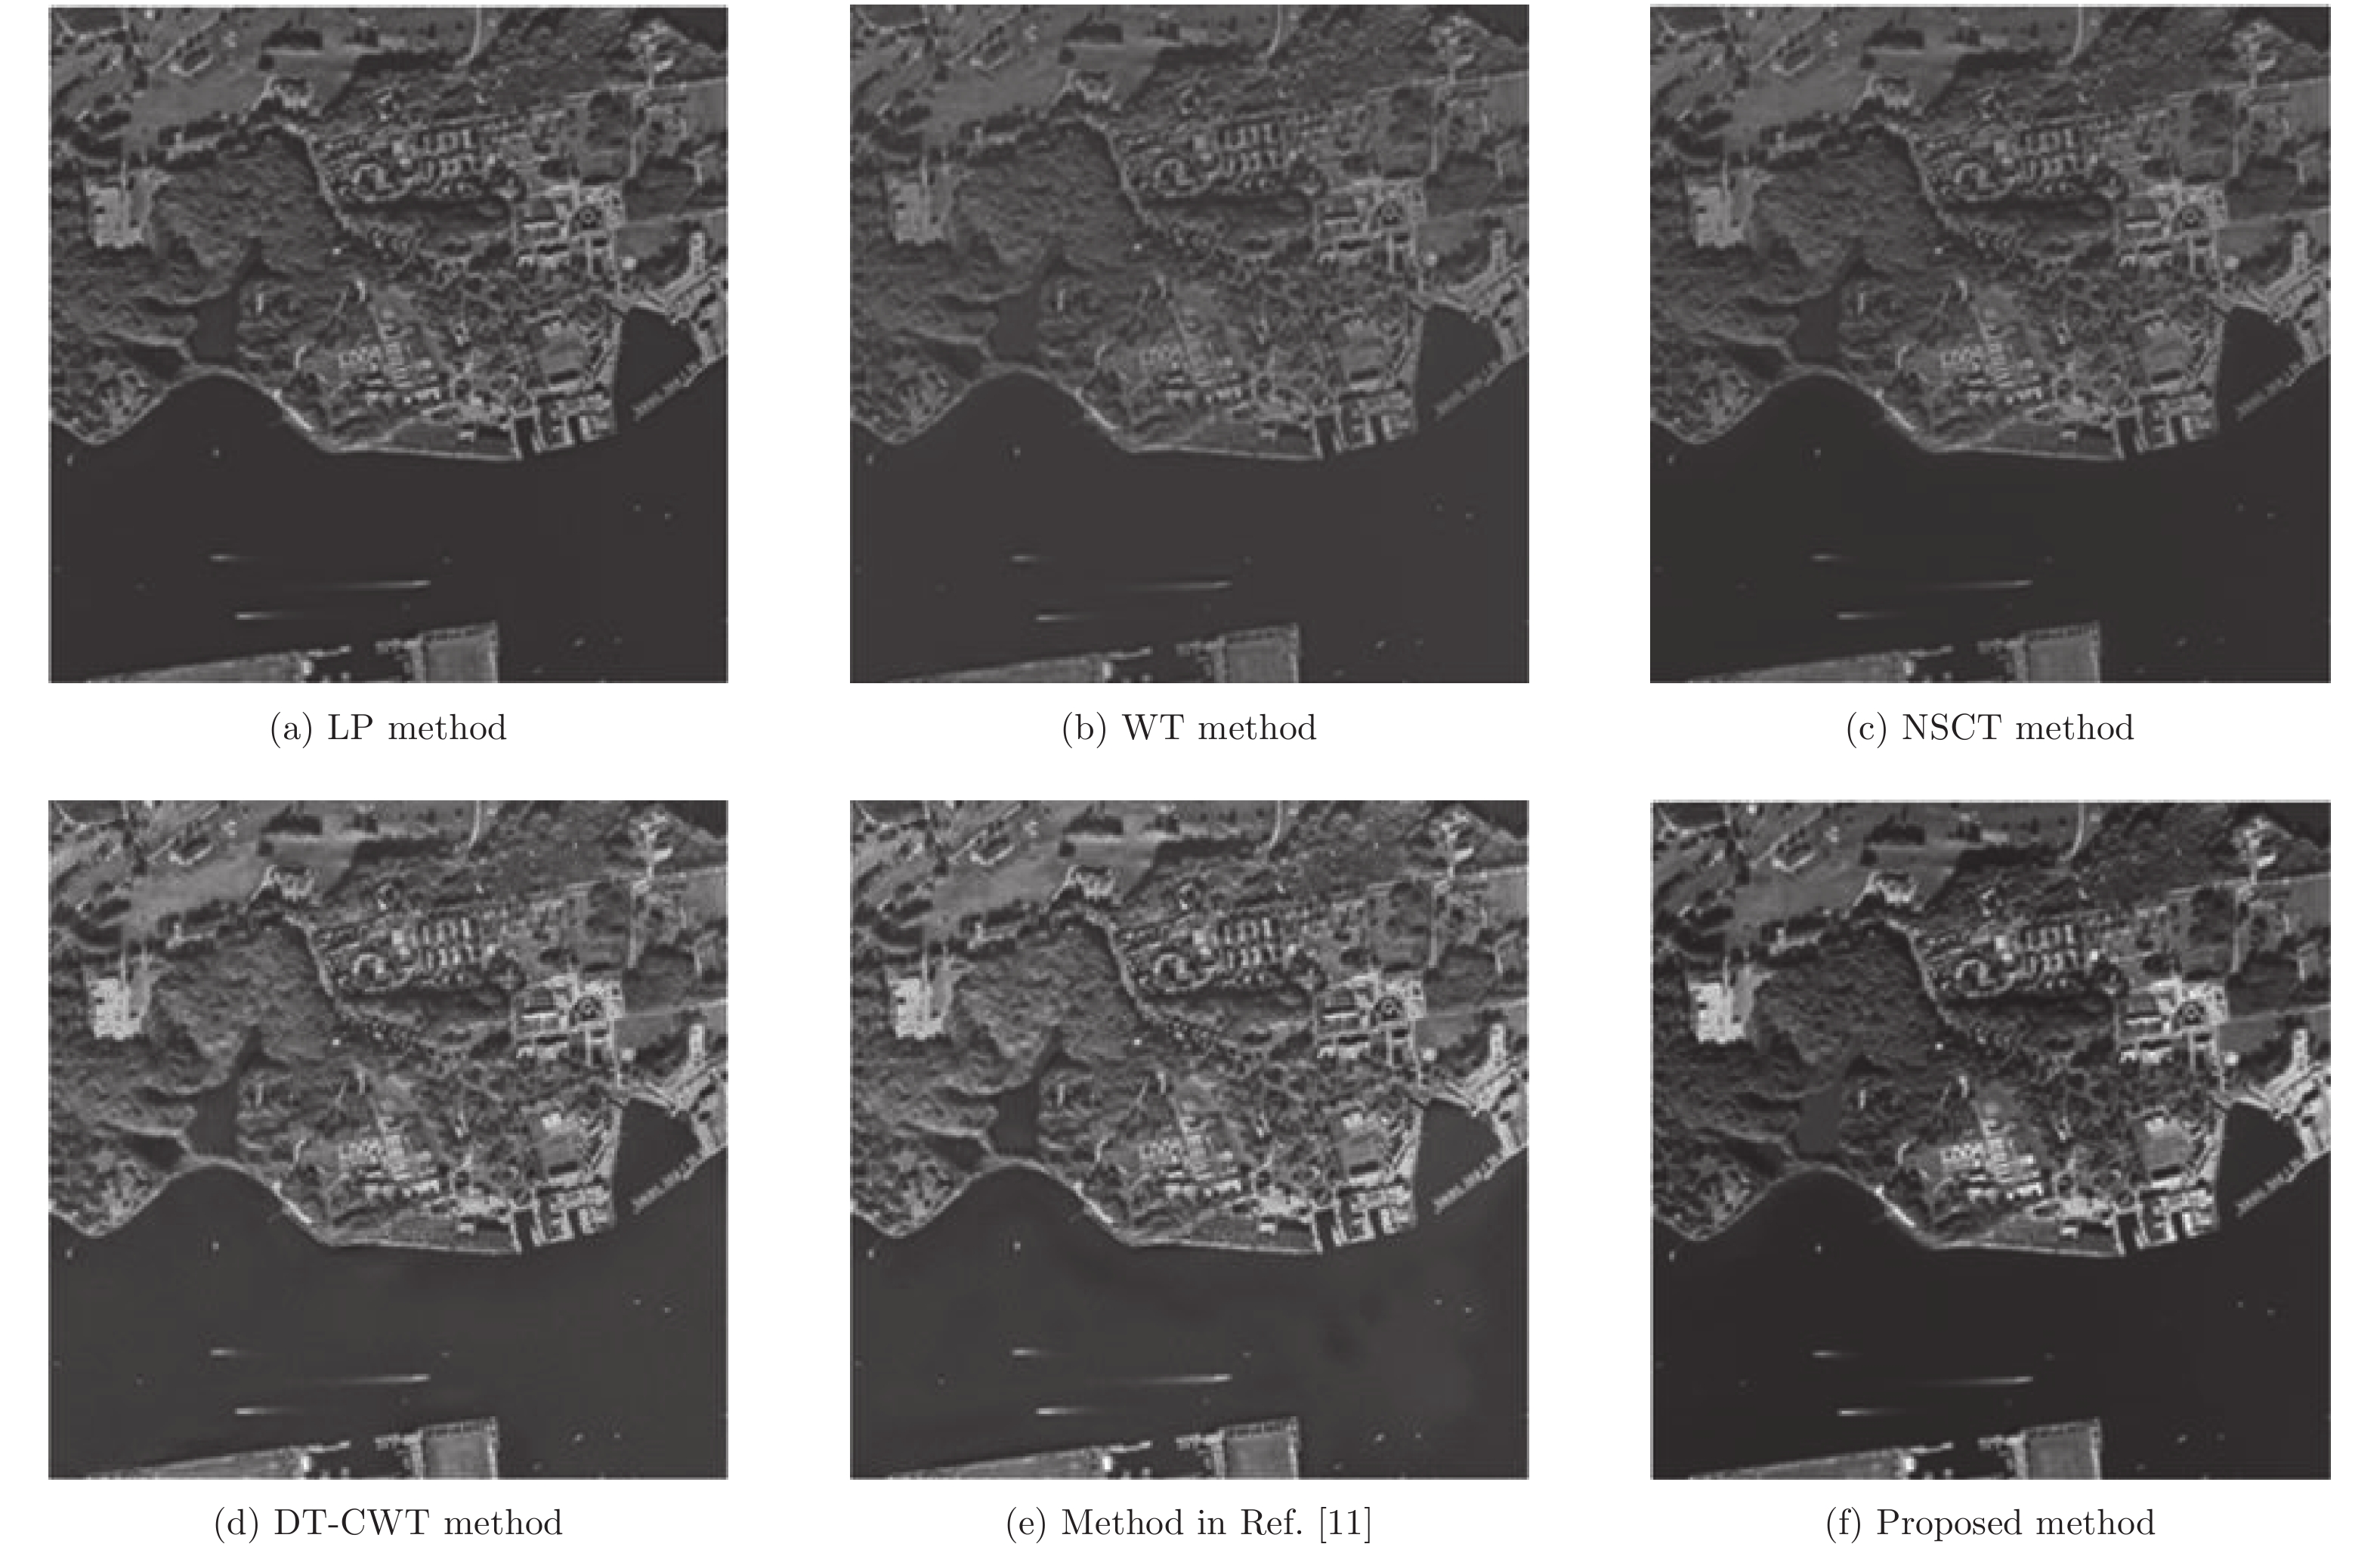
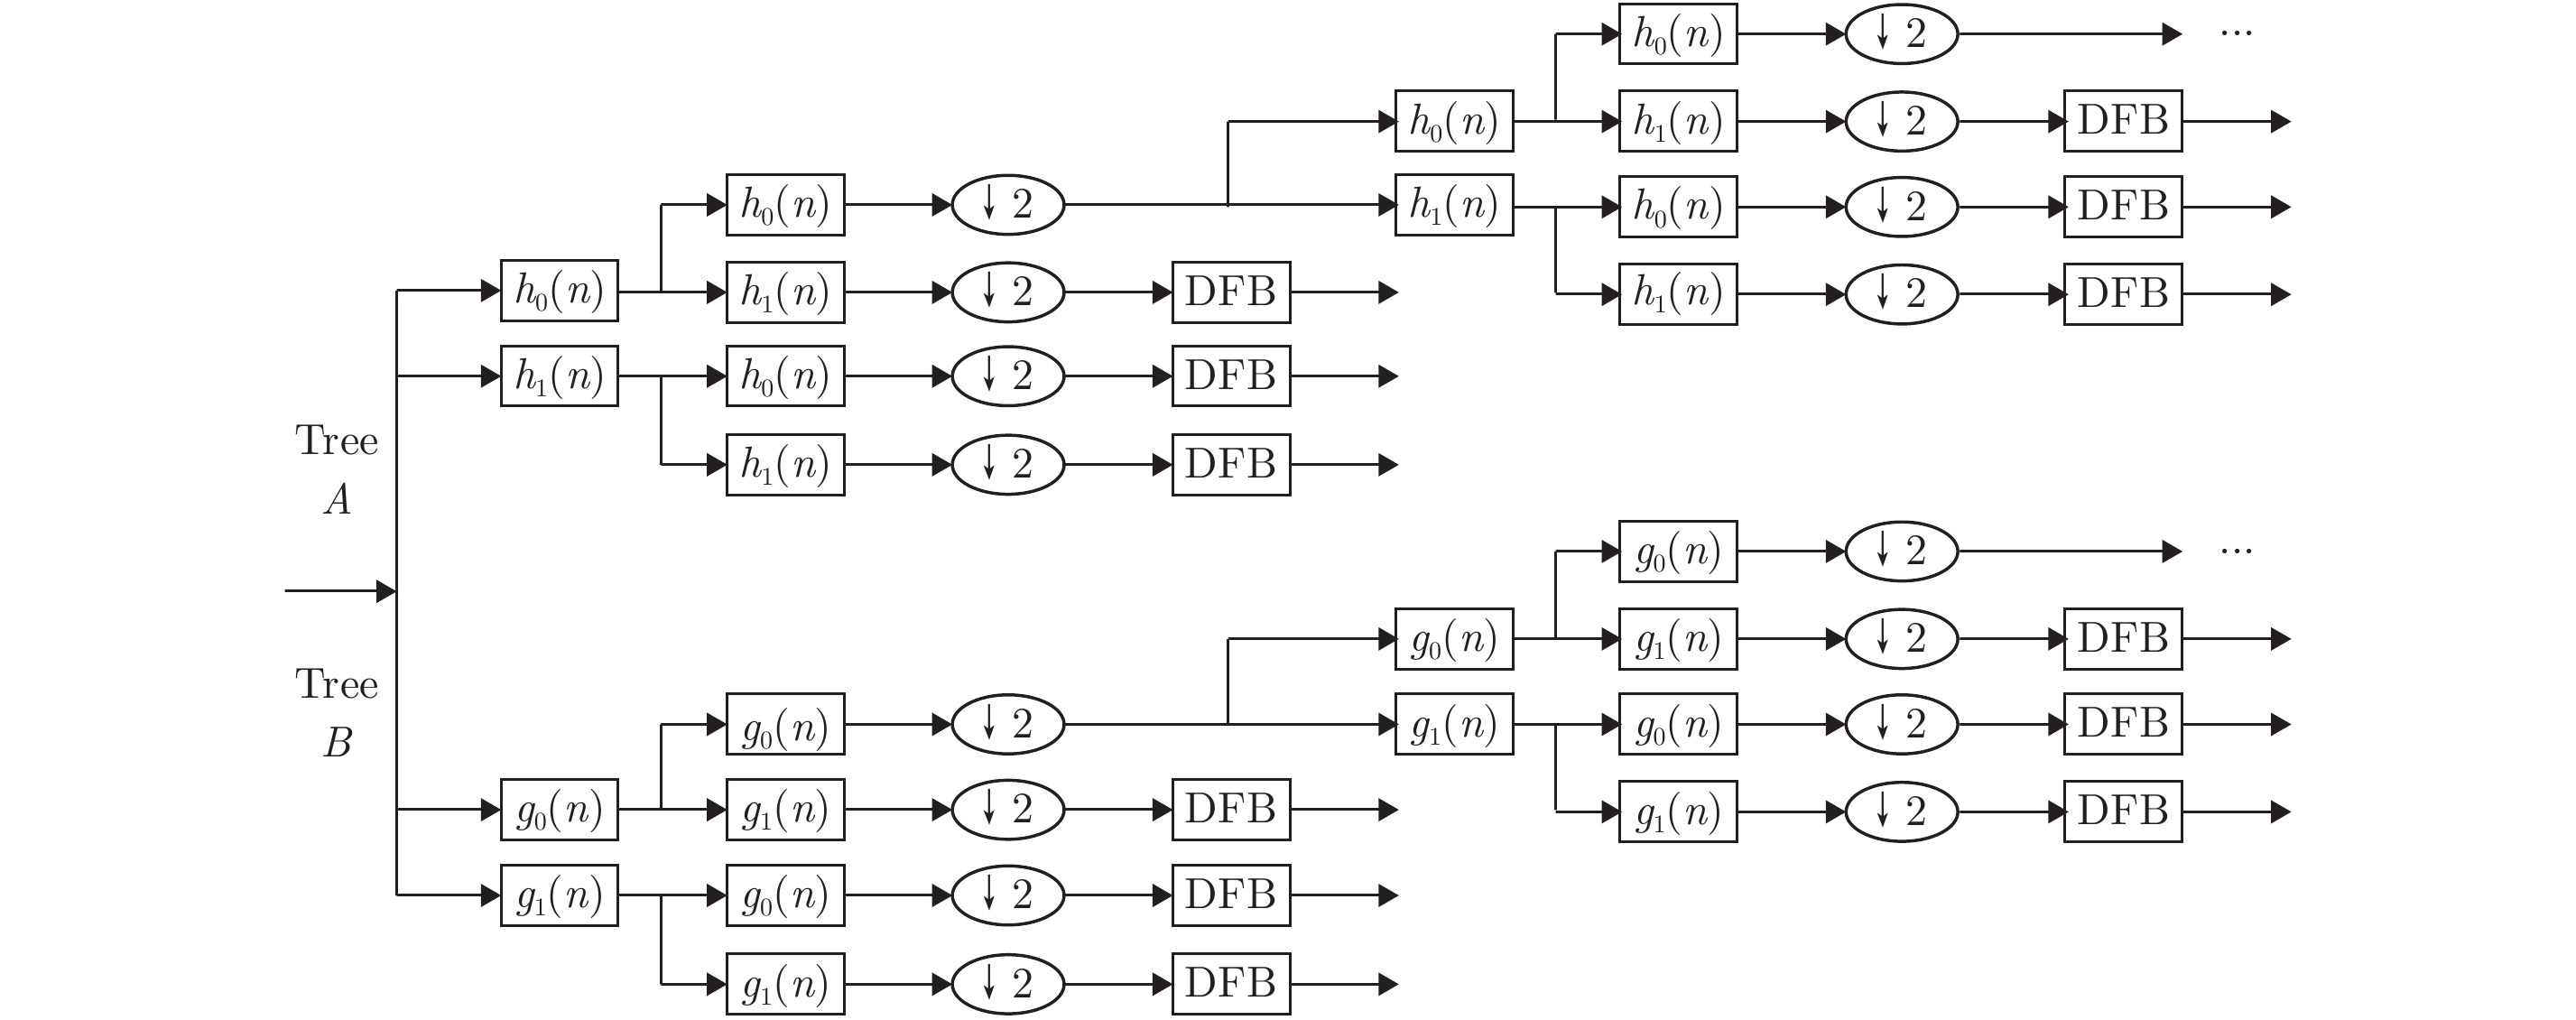
摘要: 针对红外图像与SAR图像的灰度差异性大、两者融合图像不太符合人类视觉认知的问题,提出了一种基于联合稀疏表示的复Contourlet域红外图像与SAR图像融合方法。首先对红外图像与SAR图像分别进行复Contourlet分解。然后利用K-奇异值分解(K-Singular Value Decomposition, K-SVD)方法获得两幅源图像低频分量的过完备字典,并根据联合稀疏表示模型生成联合字典,通过正交匹配追踪(Orthogonal Matching Pursuit, OMP)方法求出源图像低频分量在联合字典下的稀疏表示系数,接着采用选择最大化策略对两个低频分量的稀疏表示系数进行选取,随后进行稀疏表示重构获得融合的低频分量;对高频分量结合视觉敏感度系数和能量匹配度两个活跃度准则进行融合,以捕获源图像丰富的细节信息。最后经复Contourlet逆变换获得融合图像。与3种经典融合方法及近年来提出的基于非下采样Contourlet变换(Non-Subsampled Contourlet Transform, NSCT)、基于稀疏表示的融合方法相比,该方法能够有效突出源图像的显著特征,最大程度地继承源图像的信息。
-
关键词:
- 图像融合 /
- SAR图像 /
- 红外图像 /
- 复Contourlet变换 /
- 联合稀疏表示
-
1. Introduction
Different sensors have different descriptions for the same scene. Infrared sensors are sensitive to high heat radiation within the region. They can extract targets according to the infrared energy difference between target and background, which can pass through a certain thickness of soil layers and even concrete layers. However, compared to Synthetic Aperture Radar (SAR) imaging, infrared imaging is vulnerable to the influence of clouds, rain, and fog. SAR is an irreplaceable reconnaissance tool due to its advantages of all day, all weather, and long detection range. However, in some cases, the image information obtained by a single SAR is not enough to be used for better analysis and understanding of the target or scene[1]. Therefore, combined with the advantages of SAR reconnaissance and infrared reconnaissance, the research of SAR image and infrared image fusion can greatly improve the reconnaissance efficiency. The “LANTIRN” pod on the American F-16 fighter takes infrared reconnaissance as the main means of low altitude reconnaissance, and combines it with SAR reconnaissance to play a good effect. The Ref. [2] takes the fusion between the SAR data and the infrared data as one of the core issues of missile multi-mode guidance. The fusion between infrared image and SAR image can help to output a fused image which is more suitable for human visual perception or computer processing and analysis. It can significantly improve the lack of information obtained by a single sensor, improving the clarity of the resulting image and information content, which is conducive to more accurate, more reliable, more comprehensive access to the target or scene information. It is mainly used in military operation, national defense, resource survey, and other fields.
In recent years, the methods based on multi-scale decomposition have received extensive attentions in image fusion[3–6]. However, there are some drawbacks in these methods. Firstly, some multi-scale decomposition tools lack of shift invariance, or some do have the shift invariance, but their computational complexities are quite high. Secondly, the low-frequency components obtained by multi-scale decomposition tools are the approximate representation of the source images, in which the number of pixel grayscales close to zero is small, as a result, the low-frequency information of the source images cannot be described sparsely, and it is not convenient to capture the salient features of the source images. Therefore, in this paper, we apply the Complex Contourlet Transform (CCT) proposed in Ref. [7] to the remote sensing image fusion. This multi-scale decomposition tool is fast and shift-invariant, which can reduce the influence of the low accuracy of image registration on the fusion results. In Ref. [8], the complex contourlet transform is applied to image denoising and has achieved relatively good results, but the use of complex contourlet transform in image fusion is still in the exploratory stage. In recent years, Sparse Representation (SR) has been applied to image fusion as a new signal processing model. The image fusion method using the sparse representation model or the joint sparse representation in the Refs. [9,10] improves the image fusion effect. But the two methods directly carry out the fusion in the sparse representation domain. Considering that multi-scale decomposition tool can describe the details of the image from multiple scales, if the multi-scale decomposition tool is not used, the fusion image cannot inherit the detailed information of the source images well. In Ref. [11], a method of fusion between an infrared image and a visible image based on Non-Subsampled Contourlet Transform (NSCT) and sparse representation is proposed. However, the combined use of sparse representation and NSCT has a high computational complexity. In addition, in view of the grayscale difference between the infrared image and the SAR image and the interference of the speckle noise in SAR image, if the low-frequency component is directly fused without sparse representation, it may result in confusion of pixels and the target in the fusion image is not significant.
To this end, an image fusion method in CCT domain based on joint sparse representation is proposed to fuse the SAR image and the infrared image. The fused image via the proposed method combines well the advantages of the SAR and infrared images and has a better visual quality.
2. Complex Contourlet Transform and Joint Sparse Representation
2.1 Complex contourlet transform
Complex contourlet transform is obtained by combining contourlet transform with double-tree complex wavelet transform. The principle of this transform is that: after the original image being decomposed by double-tree complex wavelet transform, the double-tree structure is formed. Then the 2-dimensional Directional Filter Banks (DFB) are used to separate the high-frequency components in six directions, hence the sub-bands can be expanded to the numbers of 2n. The essence of CCT is to replace the Laplacian Pyramid (LP) filter structure in the contourlet transform with the double-tree structure in the Dual-Tree Complex Wavelet Transform (DT-CWT), so as to replace the original single high-frequency component with the high-frequency components in the six directions, thus the high-frequency components can better capture the details of the image. CCT takes into account the amplitude and phase information of the original signal, and the decomposition speed is fast. Meanwhile, it retains the property of shift invariance. The principle of CCT is shown in Fig. 1.
2.2 Joint sparse representation
By using an over-complete dictionary matrix that contains M atoms, a signal can be represented as a sparse linear combination of these atoms, thus revealing the essential features of the original image more sparsely. The mathematical definition of the sparse representation model is:
argminα‖α‖0,s.t.‖x−Dα‖22<ε (1) where
α represents the sparse representation coefficient,x∈RM is the original signal,‖⋅‖0 denotes the l0 norm counting the non-zero entries of a vector,ε refers to the error tolerance andε≥0 .The Joint Sparse Model (JSM) has been developed from the theory of sparse representation. Then JSM-1, JSM-2, and JSM-3 were proposed[12] in succession. These models consider that each original signal contains both a sparse portion common to all signals and a unique sparse portion of each signal. Each signal in the signal ensemble
Γ can be expressed as:Vi=Vc+Vui=D(sc+si),i=1,2,···,K (2) where
Vc represents the common part of the entire signal ensemble,Vui denotes the unique part of the i-th signal,sc refers to the common sparse representation coefficient of the entire signal ensemble, andsi is the sparse representation coefficient of the unique part of the i-th signal. The joint sparse representation model of the signal ensemble is:V=DJSRS (3) where
V=[V1V2⋮VK],DJSR=[D0···00D⋱⋮⋮⋱⋱00···0D], S=[scs1⋮sK] .3. Fusion Method of SAR Image and Infrared Image
3.1 Fusion of low-frequency components
The low-frequency components obtained by CCT are the approximate representation of the source images, but their sparseness are not enough. Considering that the acquired multi-source remote sensing images are the descriptions of the same scene from different aspects, there exists a certain correlation between the low-frequency components of the two source images, i.e. there is joint sparsity between the low-frequency components of the images to be fused, while there are some differences between them. Therefore, for the fusion of low-frequency components of the original images, the joint sparse representation is implemented on them. Thus the common features and the unique features of the low-frequency components of the image to be fused are distinguished, the fusion is performed by selecting the unique features with a larger l1 norm, while the common features remain unchanged. Specific steps are as follows.
Step 1 Create the training sample set. Given the low-frequency components of the two images to be fused are L1 and L2, the sliding window (the step size is 1) is used to form a series of 4×4 image blocks in a row-first manner. Then, all image blocks are reorganized into column vectors V1, V2 in a row-first manner, and the training sample set is chosen from them randomly.
Step 2 Joint sparse representation. The matrix V1 and V2 obtained in Step 1 are merged into a union matrix V3. The K-SVD[13] method is used to train the samples to construct the dictionary of V3. According to the joint sparse representation model:
V=[V1V2]=[DD000D][scs1s2]=DJSRS (4) Then OMP method[14] is used to find the sparse representation coefficients for Eq. (4).
Step 3 Fusion of sparse representation coefficients of low-frequency components. The fusion consists of two parts: the selection of the activity evaluation index and the design of the fusion rule. The l1 norm of is used as the evaluation index of the activity degree. Let the sparse representation coefficient after fusion be SF, then SF =
sc+argmaxsi(‖si‖1)(i=1,2) , namely, the fusion is performed by selecting the unique features with a larger l1 norm, while the common features remain unchanged, so the fusion vector matrix of the low-frequency components of the two source images isVF=DSF .Step 4 Reconstruction. Reconstructing the low-frequency component by VF is an inverse sliding window process, namely, the column vectors of the fusion vector matrix VF are restored into the image blocks. Since the step size of the sliding window is 1, there is a partial overlap between the adjacent image blocks. Thus the overlapped parts of the adjacent image blocks are subjected to weighted averaging to obtain the fused components of the low-frequency components.
3.2 Fusion of high-frequency components
The high-frequency components of the image contain details of the source images, such as textures, edges. The larger the coefficients of the high-frequency components, the richer the information of the region where the central pixel is located. When the central pixel of the image local region is the target pixel, the grayscales of the local region are more discrete and the region information entropy is larger. When the central pixel of the image local region is the background pixel, the grayscales of the local region are less discrete and the region information entropy is smaller. However, when the background information remains in all directions of the high-frequency components, the region information entropy is larger, and the region energy is larger as well. It is possible to distinguish the background pixels from the target pixels using the visual sensitivity coefficient based on the fact that the human eye is more sensitive to local changes in the image[15]. In addition, considering the fact that the discrete degree of the grayscales of the local area where the target pixels are located is generally larger than that of the background pixels, the fusion rule of the high-frequency component is designed by combining the advantages of the visual activity coefficients with the energy matching degree. The fusion rules of high-frequency components are designed so that the high-frequency components after fusion can better inherit the detail information of the source images and improve the visual effect. The visual sensitivity coefficient
η and the energy matching degreeρ are defined as:η[Cxk,l(i,j)]=Cxk,l(i,j)¯Cx(i,j) (5) ρ(i,j)=2CAk,l(i,j)CBk,l(i,j)[CAk,l(i,j)]2+[CBk,l(i,j)]2 (6) where
Cx(i,j) represents the low-frequency component coefficient,Cxk,l(i,j) denotes the high-frequency component coefficient,¯Cx(i,j)= 1M×NM∑m=0N∑n=0Cx(i+m,j+n) , and x is the infrared image A or the SAR image B.Let the energy matching degree threshold be T. When
ρ(i,j)≤T , the high-frequency components still remain the background information, then the fusion rules are as follows:CFk,l(i,j)=ηAk,l(i,j)max[CAk,l(i,j),CBk,l(i,j)]+ηBk,l(i,j)min[CAk,l(i,j),CBk,l(i,j)] (7) when
ρ(i,j)>T , the fusion rules are as follows:CFk,l(i,j)={CAk,l(i,j),CAk,l(i,j)≥CBk,l(i,j)CBk,l(i,j),CAk,l(i,j)<CBk,l(i,j) (8) The fused procedure of the proposed image fusion method based on CCT and joint sparse representation is shown in Fig. 2.
4. Experimental Results and Analysis
To evaluate the performance of the proposed image fusion method, the SAR images and infrared images of the same scene which were from the SAHARA project of the Royal Military Academy in Belgium are fused, as shown in Figs. 3(a)–3(f). Source images are in 256×256 size. The proposed image fusion method is compared with the method based on LP, the method based on Wavelet Transform (WT), the method based on NSCT, the method based on DT-CWT, and the method based on sparse representation in Ref. [11]. The experimental results by six methods are shown in Fig. 4, Fig. 5, and Fig. 6.
From Fig. 4, Fig. 5, and Fig. 6, it can be seen that the fusion image obtained by the LP fusion method is blurred, the overall brightness is relatively dim, the image local contrast is slightly low, and the target is not too salient. The WT fusion method has improved the overall brightness in the fusion image, but the edge is still blurred, and some parts of the target and background are mixed together. The fusion image obtained by the NSCT fusion method can better retain the contours of source images, but there is still a problem that the contrast is relatively low. In addition, the overall brightness of the fusion image is relatively dark. The result of DT-CWT fusion method is slightly worse than that of NSCT fusion method. Compared with the above-mentioned four methods, the overall brightness of the fused image is further improved by the method in Ref. [11]. Meantime, the contrast between the target and the background is improved. However, some obvious haloes appear in the image. For instance, there are obvious artifacts appearing in the right bottom part of Figs. 4(e), 5(e), and 6(e). The fusion image obtained by the method proposed in this paper has the best visual effect and no obvious artifacts. The overall brightness is more coincident with the human eye perception, and the image texture is continuous and the image details are clear. The image contrast is higher and the fused image inherits the original contour information of objects in the source images.
In this paper, six objective evaluation indices[16], such as Information Entropy (IE), Mutual Information (MI), Correlation Coefficient (CC), Spatial Frequency (SF), Average Gradient (AG), Standard Deviation (SD), and running time (Time) are used to compare the experimental results of six different fusion methods. Tab. 1 gives the quantitative evaluation results of the six methods.
Table 1. Quantitative evaluation of six fusion methodsImage group Fusion method IE MI CC SF AG SD Time (s) Group 1 LP method 6.839 11.405 0.687 32.852 22.406 35.499 2.126 WT method 6.724 11.119 0.869 25.667 17.947 29.863 1.827 NSCT method 6.821 11.295 0.813 26.881 18.373 33.828 50.332 DT-CWT method 6.759 11.236 0.719 25.691 17.881 32.614 3.765 Method in Ref. [11] 6.887 11.411 0.788 24.312 16.955 32.022 67.782 Proposed method 7.091 11.827 0.829 30.276 20.294 43.965 27.232 Group 2 LP method 6.973 12.070 0.739 29.114 21.005 33.825 1.728 WT method 7.097 12.181 0.883 25.643 19.298 35.330 0.898 NSCT method 6.895 11.808 0.729 23.456 17.272 33.062 39.590 DT-CWT method 6.902 11.848 0.784 22.633 16.745 32.184 3.371 Method in Ref. [11] 7.140 12.843 0.7833 30.390 22.565 37.019 53.945 Proposed method 7.305 12.615 0.869 28.648 20.887 44.539 22.733 Group 3 LP method 6.633 12.141 0.834 28.629 18.687 33.825 1.351 WT method 6.797 12.1241 0.803 25.643 19.298 35.330 0.557 NSCT method 6.801 11.973 0.864 26.105 17.539 40.052 26.433 DT-CWT method 6.665 11.723 0.846 23.539 16.745 32.184 1.371 Method in Ref. [11] 6.796 12.234 0.812 25.518 17.244 37.274 37.274 Proposed method 6.864 11.8401 0.836 28.689 18.982 40.084 18.613 From the experiments, the fusion time of the proposed method compared with the fusion method in Ref. [11] is obviously reduced. Although compared with other classical fusion methods, this method has no great advantage in time, but the improvement of fusion accuracy must be at the expense of fusion time. As can be seen from Tab. 1, the information entropy and standard deviation of the proposed method are always higher than those of the other five methods, while other indexes are sometimes slightly lower than other methods. It shows that the robustness and overall performance of the proposed method are the best, which is consistent with the subjective analysis. The proposed method is superior to other five methods in terms of information entropy and standard deviation. It reflects that the fusion image contains more detail information and has a higher local contrast. Remarkably, the sparse representation fusion method in Ref. [11] has higher spatial frequency and average gradient for the fusion results of the second group of infrared image and SAR image. But actually the reason is that the method cannot discriminate the common features and the unique features of the low-frequency components of the source images, resulting in image distortion. In the proposed method, the low-frequency components of the infrared image and the SAR image are decomposed by complex contourlet transform, and the common features of the low-frequency components of the source images are distinguished from each other by the joint sparse representation. By combining the visual sensitivity coefficient and the energy matching degree to fuse the high-frequency components, the rich detail information of the two source images is captured. The fusion result can highlight the target and enhance the background, texture, and other details. On the whole, the proposed method is superior to the other five methods in the subjective visual effect and objective quantitative evaluation index.
5. Conclusion
A novel fusion method between the SAR and infrared image in complex contourlet domain based on joint sparse representation is proposed in this paper. The method can take full advantage of SAR and infrared image. Experimental results demonstrate that the proposed fusion method has a higher performance and a better visual quality.
-
Table 1. Quantitative evaluation of six fusion methods
Image group Fusion method IE MI CC SF AG SD Time (s) Group 1 LP method 6.839 11.405 0.687 32.852 22.406 35.499 2.126 WT method 6.724 11.119 0.869 25.667 17.947 29.863 1.827 NSCT method 6.821 11.295 0.813 26.881 18.373 33.828 50.332 DT-CWT method 6.759 11.236 0.719 25.691 17.881 32.614 3.765 Method in Ref. [11] 6.887 11.411 0.788 24.312 16.955 32.022 67.782 Proposed method 7.091 11.827 0.829 30.276 20.294 43.965 27.232 Group 2 LP method 6.973 12.070 0.739 29.114 21.005 33.825 1.728 WT method 7.097 12.181 0.883 25.643 19.298 35.330 0.898 NSCT method 6.895 11.808 0.729 23.456 17.272 33.062 39.590 DT-CWT method 6.902 11.848 0.784 22.633 16.745 32.184 3.371 Method in Ref. [11] 7.140 12.843 0.7833 30.390 22.565 37.019 53.945 Proposed method 7.305 12.615 0.869 28.648 20.887 44.539 22.733 Group 3 LP method 6.633 12.141 0.834 28.629 18.687 33.825 1.351 WT method 6.797 12.1241 0.803 25.643 19.298 35.330 0.557 NSCT method 6.801 11.973 0.864 26.105 17.539 40.052 26.433 DT-CWT method 6.665 11.723 0.846 23.539 16.745 32.184 1.371 Method in Ref. [11] 6.796 12.234 0.812 25.518 17.244 37.274 37.274 Proposed method 6.864 11.8401 0.836 28.689 18.982 40.084 18.613 -
[1] Chen Lei, Yang Feng-bao, Wang Zhi-she, et al. Mixed fusion algorithm of SAR and visible images with feature level and pixel[J]. Opto-Electronic Engineering, 2014, 41(3): 55–60. [2] Zeng Xian-wei, Fang Yang-wang, Wu You-li, et al.. A new guidance law based on information fusion and optimal control of structure stochastic jump system[C]. Proceedings of 2007 IEEE International Conference on Automation and Logistics, Jinan, China, 2007: 624–627. [3] Ye Chun-qi, Wang Bao-shu, and Miao Qi-guang. Fusion algorithm of SAR and panchromatic images based on region segmentation in NSCT domain[J]. Systems Engineering and Electronics, 2010, 32(3): 609–613. [4] Xu Xing, Li Ying, Sun Jin-qiu, et al. An algorithm for image fusion based on curvelet transform[J]. Journal of Northwestern Polytechnical University, 2008, 26(3): 395–398. [5] Shi Zhi, Zhang Zhuo, and Yue Yan-gang. Adaptive image fusion algorithm based on shearlet transform[J]. Acta Photonica Sinica, 2013, 42(1): 115–120. DOI: 10.3788/gzxb [6] Liu Jian, Lei Ying-jie, Xing Ya-qiong, et al. Fusion technique for SAR and gray visible image based on hidden Markov model in non-subsample shearlet transform domain[J]. Control and Decision, 2016, 31(3): 453–457. [7] Chen Di-peng and Li Qi. The use of complex contourlet transform on fusion scheme[C]. Proceedings of World Academy of Science, Engineering and Technology, Prague, Czech Republic, 2005: 342–347. [8] Wu Yi-quan, Wan Hong, and Ye Zhi-long. Fabric defect image noise reduction based on complex contourlet transform and anisotropic diffusion[J]. CAAI Transactions on Intelligent Systems, 2013, 8(3): 214–219. [9] Wei Qi, Bioucas-Dias J, Dobigeon N, et al. Hyperspectral and multispectral image fusion based on a sparse representation[J]. IEEE Transactions on Geoscience and Remote Sensing, 2015, 53(7): 3658–3668. DOI: 10.1109/TGRS.2014.2381272 [10] Yu Nan-nan, Qiu Tian-shuang, Bi Feng, et al. Image features extraction and fusion based on joint sparse representation[J]. IEEE Journal of Selected Topics in Signal Processing, 2011, 5(5): 1074–1082. DOI: 10.1109/JSTSP.2011.2112332 [11] Wang Jun, Peng Jin-ye, Feng Xiao-yi, et al. Image fusion with nonsubsampled contourlet transform and sparse representation[J]. Journal of Electronic Imaging, 2013, 22(4): 043019. DOI: 10.1117/1.JEI.22.4.043019 [12] Duarte M F, Sarvotham S, Baron D, et al.. Distributed compressed sensing of jointly sparse signals[C]. Proceedings of Conference Record of the Thirty-Ninth Asilomar Conference on Signals, Systems and Computers Asilomar, Pacific Grove, CA, USA, 2005: 1537–1541. [13] Aharon M, Elad M, and Bruckstein A. rmK-SVD: An algorithm for designing overcomplete dictionaries for sparse representation[J]. IEEE Transactions on Signal Processing, 2006, 54(11): 4311–4322. DOI: 10.1109/TSP.2006.881199 [14] Mallat S G and Zhang Zhi-feng. Matching pursuits with time-frequency dictionaries[J]. IEEE Transactions on Signal Processing, 1993, 41(12): 3397–3415. DOI: 10.1109/78.258082 [15] Kong Wei-wei and Lei Ying-jie. Technique for image fusion based on NSST domain and human visual characteristics[J]. Journal of Harbin Engineering University, 2013, 34(6): 777–782. [16] Fan Xin-nan, Zhang Ji, Li Min, et al. A multi-sensor image fusion algorithm based on local feature difference[J]. Journal of Optoelectronics·Laser, 2014, 25(10): 2025–2032. 期刊类型引用(4)
1. 王志豪,李刚,蒋骁. 基于光学和SAR遥感图像融合的洪灾区域检测方法. 雷达学报. 2020(03): 539-553 . 本站查看
2. 吴文达,张葆,洪永丰,张玉鑫. 机载红外与合成孔径雷达共孔径天线设计. 中国光学. 2020(03): 595-604 . 百度学术
3. 陈广秋,梁小伟,段锦,才华. 多级方向引导滤波器及其在多传感器图像融合中的应用. 吉林大学学报(理学版). 2019(01): 129-138 . 百度学术
4. 李颖奎,陈广秋,杨阳,刘智,才华. 多级方向加权最小二乘滤波器及其在多传感器图像融合中的应用. 液晶与显示. 2018(08): 703-715 . 百度学术
其他类型引用(5)
-